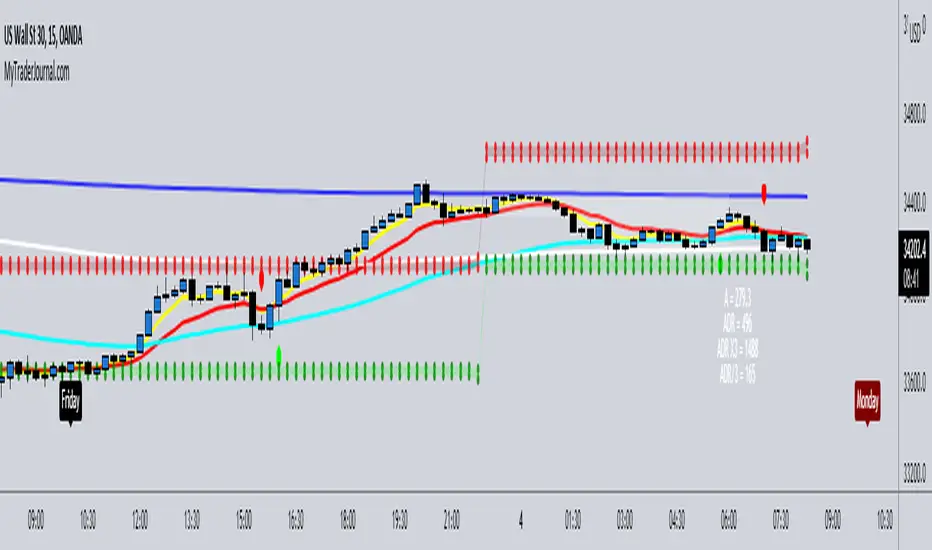
Market Maker Matrx by Jusimen V2.0Compilations of various indicators that will help with the Market Maker Method Strategy.
This has been modified to suit the Market Maker Matrx iteration of the strategy.
It contains:
5 Emas - 5, 13, 50, 200, 800, Shifts
A-Range - Shows Pips
ADR - Shows Pips, Gives ADR High and ADR Low Boxes (10 & 20 Days)
Killzone
Week Days - Named
______________________________________________
Jusimen
ابحث في النصوص البرمجية عن "the strat"
RS breakout alertsUP = LONG
DOWN = SHORT
The strategy is always in the market - there is no take profit or stop loss logic.
Focal point of the strategy is to never miss a trend. This is easily programmable with profitview.

MACD Indicator BFThis is my MACD strategy but in indicator format so I can include alerts. The default settings are the same as in the strategy. The long and short conditions that the alerts are attached to are when the delta (usually illustrated as the histogram) crosses above or below the zero line respectively. There is one alert for long, one for short.

THE QUANTUM TRADER BITCOINThe Quantum Trader is a Algorithmic Automated Trading System that trades XBTUSD and BTC/USD with an emphasis on minimizing risk.
This algorithm trades multiple of our individual algorithms in an attempt to have a large number of uncorrelated algorithms trading concurrently,
thereby smoothing out the equity curve in an attempt to provide more consistency in the returns.
The Quantum trader utilizes swing trading algorithms along with day trading algorithms which can enter positions either Long or Short, and
take profits either Long or Short depending on market characteristics.
The Quantum Trader was built for automated trading, but can be used for manual trading also.
The Quantum Trader was designed to be used with Heikin Ashi candles on 3H chart. Indicator uses security function for profit points so alerts will give a warning
however, gaps are OFF and Lookahead is ON and trades are entered, and profits are taken at candle close.
Trades are placed following a strict algorithm, and nothing is left to subjective opinion.
The Quantum Trader utilizes a sophisticated pattern recognition algorithms that have been rigorously tested, and has been traded live since March 2019
When compared to other algorithmic trading systems, the quantum trader places fewer trades which helps contribute to the smaller draw down seen in the back-testing.
Algorithmic Trading Strategy Compared to Paid Signal Groups and Online Trading Classes
While there is an appeal to paid signal groups, and online trading classes. Most of the trading tips and signals you find online are sadly too basic and lacking an analytical approach to defend the statements which are made.
Comments are made and repeated that simply don’t have any empirical evidence to back them up.
In algorithmic trading back-testing and monthly system overviews is (or should be) part of the design methodology, the strategy will be analyzed for multiple time periods to include bull and bear markets.
We test and trade our algorithms across multiple market cycles to include Bear and Bull markets.
With Algorithmic Trading, nothing is left to interpretation. The algo will place trades as it sees fit and will attempt to generate positive returns as trades are methodically placed on individuals accounts.
There is no staring at charts, no drawing of trend lines , no signals to take and all the negative emotions involved with trading are minimized.
Lastly, the potential for human errors is minimized since trades are placed automatically by the Automated Trading System as opposed to signals learned in an online trading course or signals received.

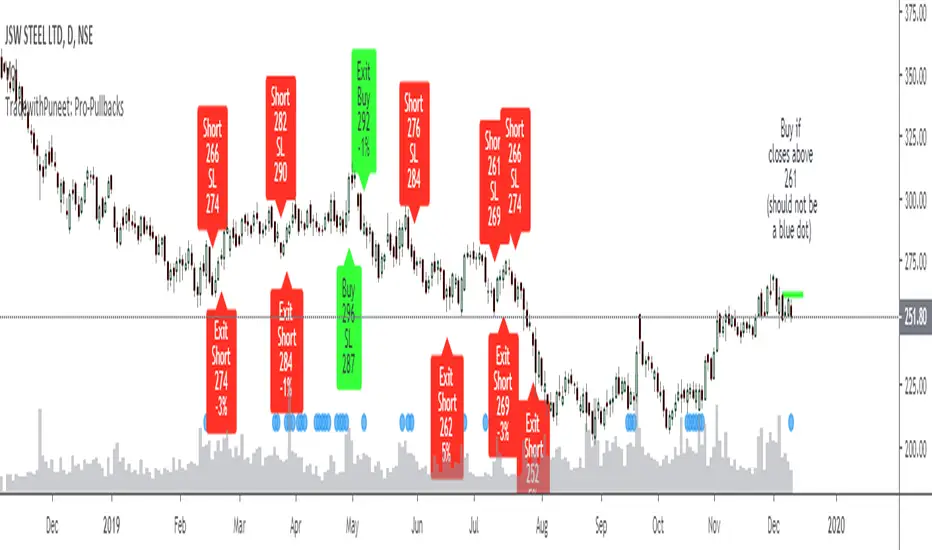
TradewithPuneet: Pro-PullbacksThe Pro-Pullbacks strategy is designed to trade pullbacks . In other words, this strategy will give you:
• BUY signals : When in an already established Uptrend , a stock falls but then resumes its upward trajectory.
• SHORT signals : When in an already established Downtrend , a stock rises but then resumes its downward trajectory.
Through this strategy, we aim to trade in the direction of an already established trend by entering on a pullback. Thus, instead of trying to catch the whole trend, this strategy tries to profit from an already established trend.
The strategy uses certain filters to identify whether the stock is in Uptrend or Downtrend. Next, it identifies pullbacks to an identified trend. Pullbacks are sometimes too short or too deep. This strategy ignores such short & deep pullbacks. Finally, it identifies certain threshold levels (for confirmation), beyond which the stock is expected to resume the original trend. If the stock closes beyond the threshold level, it gives the necessary BUY or SHORT signal.
The strategy guides you the price level at which to enter a trade. You can enter your choice of target profit and stop loss levels.
This strategy is only built for stocks, not for indices or any other financial instrument.
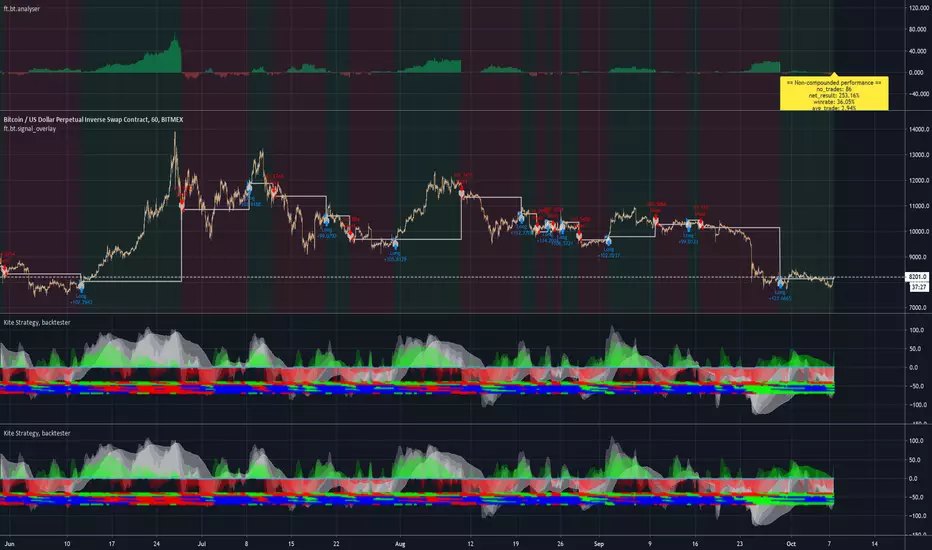
Kite Strategy, backtesterThis is an alertable version of the Kite-Crossing-Oscillator-backtester . One can use the strategy version to optimize settings and subsequently this version to create automated alerts on those settings. Alternatively one can also use the ft.bt.analyser to analyse/optimize this study performance directly by selecting the signal line as input. Happy trading!
Setting-Less Trend-Step FilteringIntroduction
Indicators settings have been a major concern in trading strategies, in order to provide the best results each indicators involved in the strategy must have its settings optimized, when using only 1 indicator this task can easily be achieved, but an increasing number of indicators involve more slower computations, lot of softwares will use brute force for indicators settings optimization, this involve testing each indicator settings and see which setting/combination maximize the equity, in order to fasten this process softwares can use a user defined range for the indicator settings. Nonetheless the combination that maximize the equity at time t might be different at time t+1...n .
Therefore i propose an indicator without any numerical setting that aim to filter small price variations using the architecture of the T-step lsma, such indicator can provide robust filtering and can therefore be used as input for other indicators.
Robustness Vs Non Robustness
Robustness is often defined as the ability of certain statistical tools to be less affected by outliers, outliers are defined as huge variations in a data-set, high volatility movements and large gaps might be considered as outliers. However here we define robustness as the ability of an indicator to be non affected by price variations that are not correlated with the main trend, which can be defined in technical analysis as pullbacks.
Some small pullbacks in INTEL, the indicator is not affected by them, which allow the indicator to filter the price in a "smart" way.
This effect is made possible by using exponential averaging in the indicator, exponential averaging is defined as y = sc*x + (1-sc)*y , with 1 > sc > 0 . Here sc is calculated in a similar way as the kalman gain, which is in the form of a/(a + b) , in our case this is done with :
sc = abs(input - nz(b ))/(abs(input - nz(b )) + nz(a ))
Non Robust Version Of The Indicator
The user is allowed to use the non robust version of the indicator by unchecking "robust" in the setting panel, this allow a better fit with the price at the cost of less filtering.
robust checked
robust unchecked
Conclusion
I proposed a technical indicator that aim to filter short frequencies without the use of parameters, the indicator proven to be robust to various pullbacks and therefore was able to follow the main trend, although using the term trend for such small price variations might be wrong. Removing high frequencies is always beneficial in trading, noisy series are harder to manipulate, this is why you'll see a lot of indicators using median price often defined as hl2 instead of the closing price.
Like previous settings-less indicators i published this one can behave differently depending on the time frame selected by the user, lower time frames will make the indicator filter more. I'll try to make more setting-less indicators that will correct this effect.
Acknowledgements
The support and interest of the community is only thing that allowed me to be where i'am today, i'am thankful. Special thanks to the tv staff, LucF, and my family who may not have believed in this project but are still proud of their son.

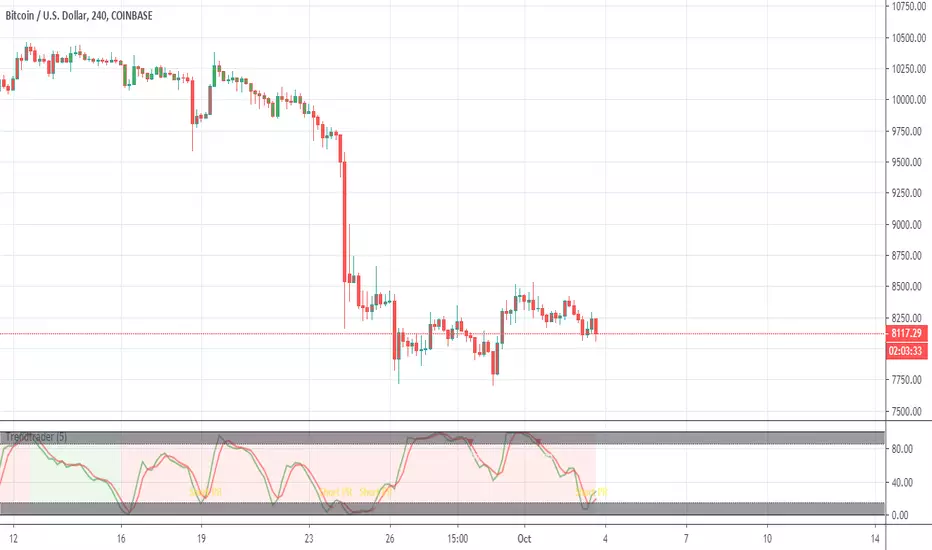
Trendtrader with profit/rentry==Strategy==
Adjust trend code until the majority of the up-trends are green and the downtrends are red. Take 20% profits at the first and second take profit levels while leaving the rest of the trade in until close.
==Indicator includes==
EMA cross, trend analysis, stoc-RSI TP and re-entries.
==Credits==
Trade Indicators for the strategy, jhanson107, for the trend indicator, and Zekis for helping with the TP and re-entries.
Multistep AutocorrelationAutocorrelation, also known as serial correlation, is the correlation of a signal with a delayed copy of itself as a function of delay. Informally, it is the similarity between observations as a function of the time lag between them. The analysis of autocorrelation is a mathematical tool for finding repeating patterns, such as the presence of a periodic signal obscured by noise, or identifying the missing fundamental frequency in a signal implied by its harmonic frequencies. It is often used in signal processing for analyzing functions or series of values, such as time domain signals.
This multistep autocorrelation function calculates the correlation of roc (rate of change) between an asset at t and t-1 as well as the correlation of the same asset at t and t-4. The output is an average of the two.
If both outputs show a positive correlation, the color will be green.
If only one shows a positive correlation, the color will be yellow.
If neither show a positive correlation, the color will be red.
This indicator can be useful as a filter for strategy entry logic (only enter on strong correlation and the strategy entry condition), or as standalone confirmation of strength in a specific direction. It can also be used to filter chop.
Another potential usecase would be as a variable in regression applications.
Enjoy!

LIB: Puell MultipleIndicator Overview
This metric looks at the supply side of Bitcoin's economy - bitcoin miners and their revenue.
It explores market cycles from a mining revenue perspective. Bitcoin miners are sometimes referred to as compulsory sellers due to their need to cover fixed costs of mining hardware in a market where price is extremely volatile. The revenue they generate can therefore influence price over time.
The Puell Multiple is calculated by dividing the daily issuance value of bitcoins (in USD) by the 365-day moving average of daily issuance value.
How It Can Be Used
There are periods of time where the value of bitcoins being mined and entering the ecosystem is too great or too little relative to historical norms.
Understanding these periods of time can be beneficial to the strategic Bitcoin investor.
The chart above highlights periods where the value of Bitcoin's issued on a daily basis has historically been extremely low (Puell Multiple entering green box), which was a good time to buy Bitcoin. It also shows periods where the daily issuance value was extremely high (Puell Multiple entering red box), historically a good time to sell Bitcoin.

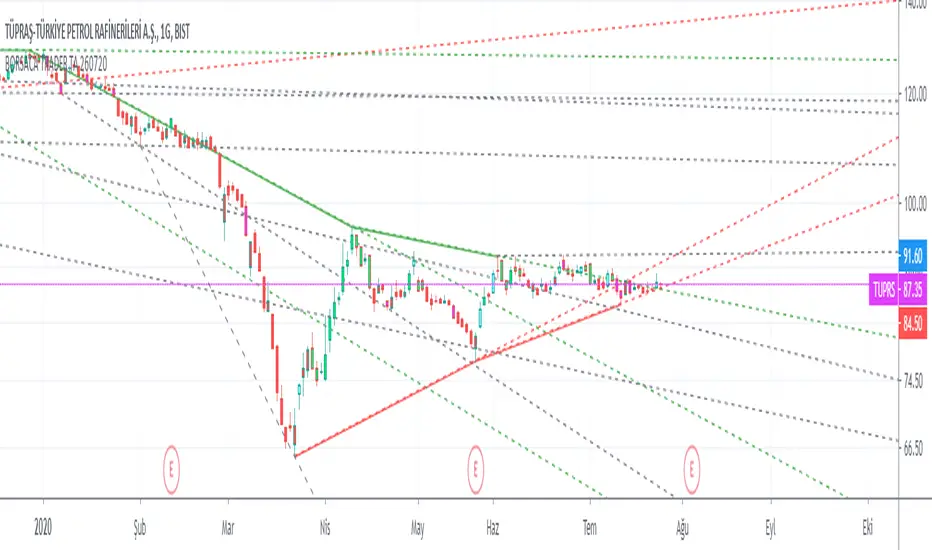
BORSACA TRADERBORSACA TRADER does NOT REPAINT. If the signal occurs it will be forever. Easy and profitable strategy optimized for Crypto, Foreks and Stock Markets...
This indicator gives you Long and Exit signals all timeframes...
BORSACA TRADER is optimized to catch trend movements as soon as possible and maximize profitability.
Strategy tester results. 96% Profitable on BTCUSD Daily scale. Test other markets you want.
WE RELY ON OUR INDICATOR TO THE END. AND WE ASSURE YOU THERE IS NOTHING BETTER THAN THE BORSACA TRADER INDICATOR.
Best regards and happy trading.
Herif's winning strategy option. Check the strategy tester results success than %96
Safe Mode as optional parameter. You can enable this to prevent some riskier trades to happen at the cost of some profitability. Use it if you are more conservative in trading.
Normal Mode signals for Buy and Sell. Trade Mode signals for buy and sell use with support and resistance levels.
Auto Support And Resistance ..
Auto Fibonacci Levels...
BORSACA TRADER indicator is the best option for everybody in financial markets. Check my Profile Page for more information and follow me, like and favorite my indicator and support your positive response and take a message for 10 days trial.
UPDATED PINE SCRIPT V4
Happy trading. Good luck :)
Alnami_Quantum_blocks v.11_AlertsThis indicator is intended to be used to set up alerts for the strategy quantum block v.11 strategy.
Those alerts can be used for automated trading through plugins like autoview, jubot, ..etc
set the alert to trigger when its value cross over 0.5 for buy
and set it when its value cross under -0.5 for sell
Best Regards,
Abdullah
I spent a lot of time and resource in providing the above, If this script/back tests helped in making some profits, then kindly express your appreciation and support to this work by sending some altcoins to any of the following wallets, this will encourage me sharing more stuff with the public:
BTC : 15VLCLZRkEhhZn6E4gNjMLVYnmCcUzKvWU
LTC : LN6mE6aZhEqVVfssmaQ3kk8PPspWQ5wToy
ETH : 0x7901035f2b6f334fa404d0ceb187d7bfcfdb72ce

Running Equity - A New Indicator For Optimal Markets DetectionIntroduction
Winning trades and gaining profits in trading is not impossible, however having gross profits superior to gross losses is what make trading challenging, it is logical to think that it is better to open a position when the probability of winning the trade is high, such probability can’t be measured with accuracy but a lot of metrics have been proposed in order to help determining when to open positions, technical analysis support the fact that a trending market is the best market condition for opening a position, which is logical when using a trend following strategy, therefore a long-term positive auto-correlated market is optimal for trading, this is why this paper present a new method for detecting optimal markets conditions in order to open a position.
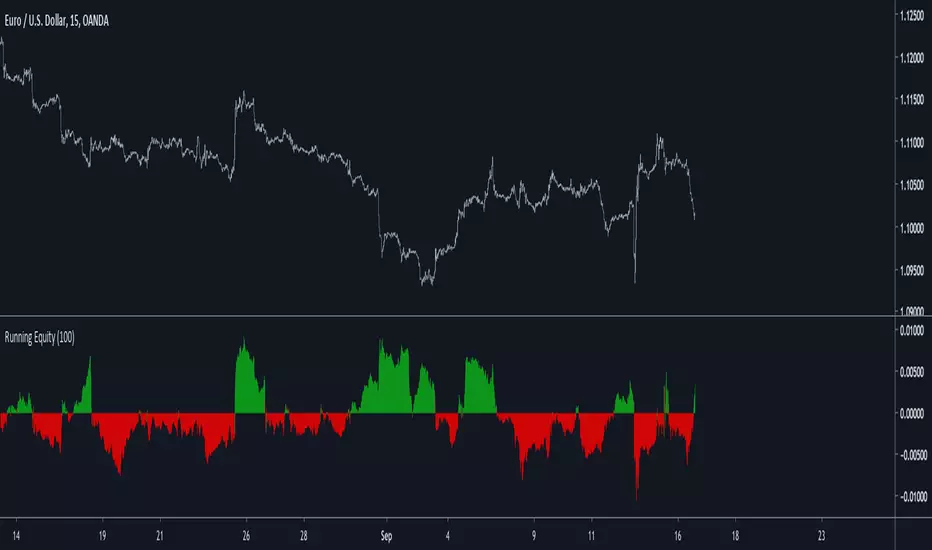
The Indicator
The proposed indicator is based on the assumption that positive returns using a trend following strategy are a strong indication of trend strength, the proposed indicator is built from the conditions of a simple SMA cross trend following strategy, which are to go long when price > SMA and to go short when price < SMA. Then the equity from those conditions is built, in order to provide a more flexible indicator, length control the period of the sum.
When the indicator is positive it means that the market allow for potential returns, it can thus be considered being trending. Else a negative value of the indicator indicate a ranging market that won't allow for returns.
Filtering Bad Trades
The indicator can be used to filter bad trades entries, in this example a Bollinger band breakout strategy is used, without any changes the strategy return the following equity on EURUSD
The proposed indicator is then applied with the following conditions : buy and sell only if Req > 0
With an indicator period = 100 we filtered unprofitable trades.
Conclusion
I presented a new indicator for the detection of optimal markets based on a running equity. I hope both indicators may find applications in technical analysis and help investors get pertinent outputs from them.
it would mean a lot if you could read the original paper : figshare.com
Borsaca Demo Limited Time OnlyThis indicator does NOT REPAINT. If the signal occurs it will be forever. Easy and profitable strategy optimized for Crypto, Foreks and Stock Markets...
This indicator gives you Long and Exit signals all timeframes...
BORSACA TRADER is optimized to catch trend movements as soon as possible and maximize profitability.
Strategy tester results. 96% Profitable on BTCUSD Daily scale. Test other markets you want.
WE RELY ON OUR INDICATOR TO THE END. AND WE ASSURE YOU THERE IS NOTHING BETTER THAN THE BORSACA TRADER INDICATOR.
Best regards and happy trading.
Herif's winning strategy option. Check the strategy tester results success than %96
Safe Mode as optional parameter. You can enable this to prevent some riskier trades to happen at the cost of some profitability. Use it if you are more conservative in trading.
Normal Mode signals for Buy and Sell. Trade Mode signals for buy and sell use with support and resistance levels.
Auto Support And Resistance ..
Auto Fibonacci Levels...
BORSACA TRADER indicator is the best option for everybody in financial markets. Check my Profile Page for more information and follow me, like and favorite my indicator and support your positive response and take a message for 10 days trial.
Happy trading. Good luck :)

BorsacaThis indicator does NOT REPAINT. If the signal occurs it will be forever. Easy and profitable strategy optimized for Crypto, Foreks and Stock Markets...
This indicator gives you Long and Exit signals all timeframes...
BORSACA TRADER is optimized to catch trend movements as soon as possible and maximize profitability.
Strategy tester results. 96% Profitable on BTCUSD Daily scale. Test other markets you want.
WE RELY ON OUR INDICATOR TO THE END. AND WE ASSURE YOU THERE IS NOTHING BETTER THAN THE BORSACA TRADER INDICATOR.
Best regards and happy trading.
Herif's winning strategy option. Check the strategy tester results success than %96
Safe Mode as optional parameter. You can enable this to prevent some riskier trades to happen at the cost of some profitability. Use it if you are more conservative in trading.
Normal Mode signals for Buy and Sell. Trade Mode signals for buy and sell use with support and resistance levels.
Auto Support And Resistance ..
Auto Fibonacci Levels...
BORSACA TRADER indicator is the best option for everybody in financial markets. Check my Profile Page for more information and follow me, like and favorite my indicator and support your positive response and take a message for 10 days trial.
Happy trading. Good luck :)

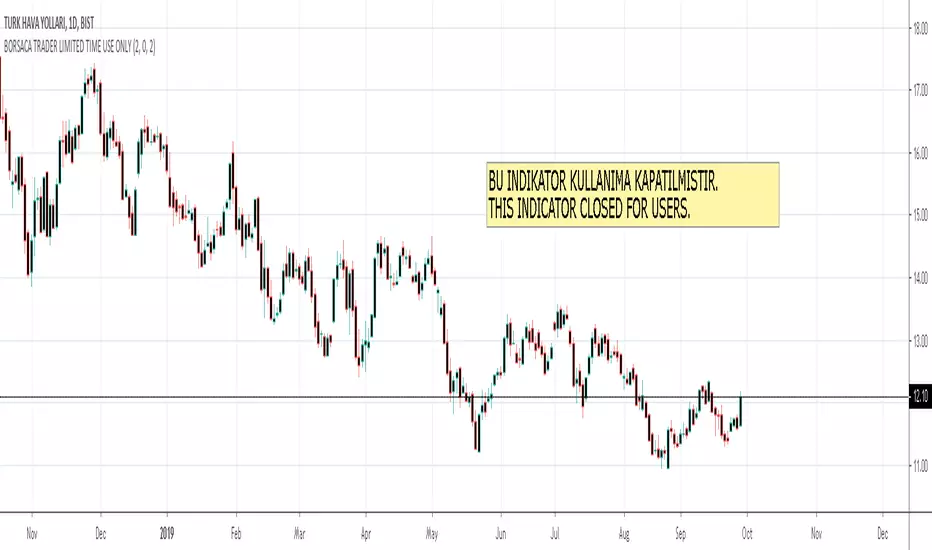
BORSACA TRADER LIMITED TIME USE ONLYThis indicator does NOT REPAINT. If the signal occurs it will be forever. Easy and profitable strategy optimized for Crypto, Foreks and Stock Markets...
This indicator gives you Long and Exit signals all timeframes...
BORSACA TRADER is optimized to catch trend movements as soon as possible and maximize profitability.
Strategy tester results. 96% Profitable on BTCUSD Daily scale. Test other markets you want.
WE RELY ON OUR INDICATOR TO THE END. AND WE ASSURE YOU THERE IS NOTHING BETTER THAN THE BORSACA TRADER INDICATOR.
Best regards and happy trading.
Herif's winning strategy option. Check the strategy tester results success than %96
Safe Mode as optional parameter. You can enable this to prevent some riskier trades to happen at the cost of some profitability. Use it if you are more conservative in trading.
Normal Mode signals for Buy and Sell.
Trade Mode signals for buy and sell use with support and resistance levels.
Auto Support And Resistance..
Auto Fibonacci Levels...
BORSACA TRADER indicator is the best option for everybody in financial markets. Check my Profile Page for more information and follow me, like and favorite my indicator and support your positive response and take a message for 10 days trial.
Happy trading. Good luck :)